Kotlin Notebook でサポートされている出力形式
Kotlin Notebook は、テキスト、HTML、画像など、さまざまな出力タイプをサポートしています。外部ライブラリを利用することで、出力オプションを拡張し、チャートやスプレッドシートなどでデータを可視化できます。
各出力は、Jupiter MIME type を何らかのデータにマッピングするJSONオブジェクトです。このマップから、Kotlin Notebook はサポートされているMIMEタイプのうち、優先順位が最も高いものを選択し、次のようにレンダリングします。
- Text は、
text/plainMIMEタイプを使用します。 - BufferedImage クラス は、Base64文字列にマッピングされた
image/pngMIMEタイプを使用します。 - Image クラス と LaTeX format は、
text/htmlMIMEタイプを内部にimgタグ付きで使用します。 - Kotlin DataFrame tables と Kandy plots は、独自の内部MIMEタイプを使用します。これらは静的なHTMLまたは画像によってバックアップされます。これにより、GitHub上で表示できます。
マッピングは手動で設定できます。たとえば、Markdownをセルの出力として使用するには、次のようにします。
MimeTypedResult(
    mapOf(
        "text/plain" to "123",
        "text/markdown" to "# HEADER",
        //other mime:value pairs
    )
)
あらゆる種類の出力を表示するには、DISPLAY() 関数を使用します。これは、複数の出力を組み合わせることも可能です。
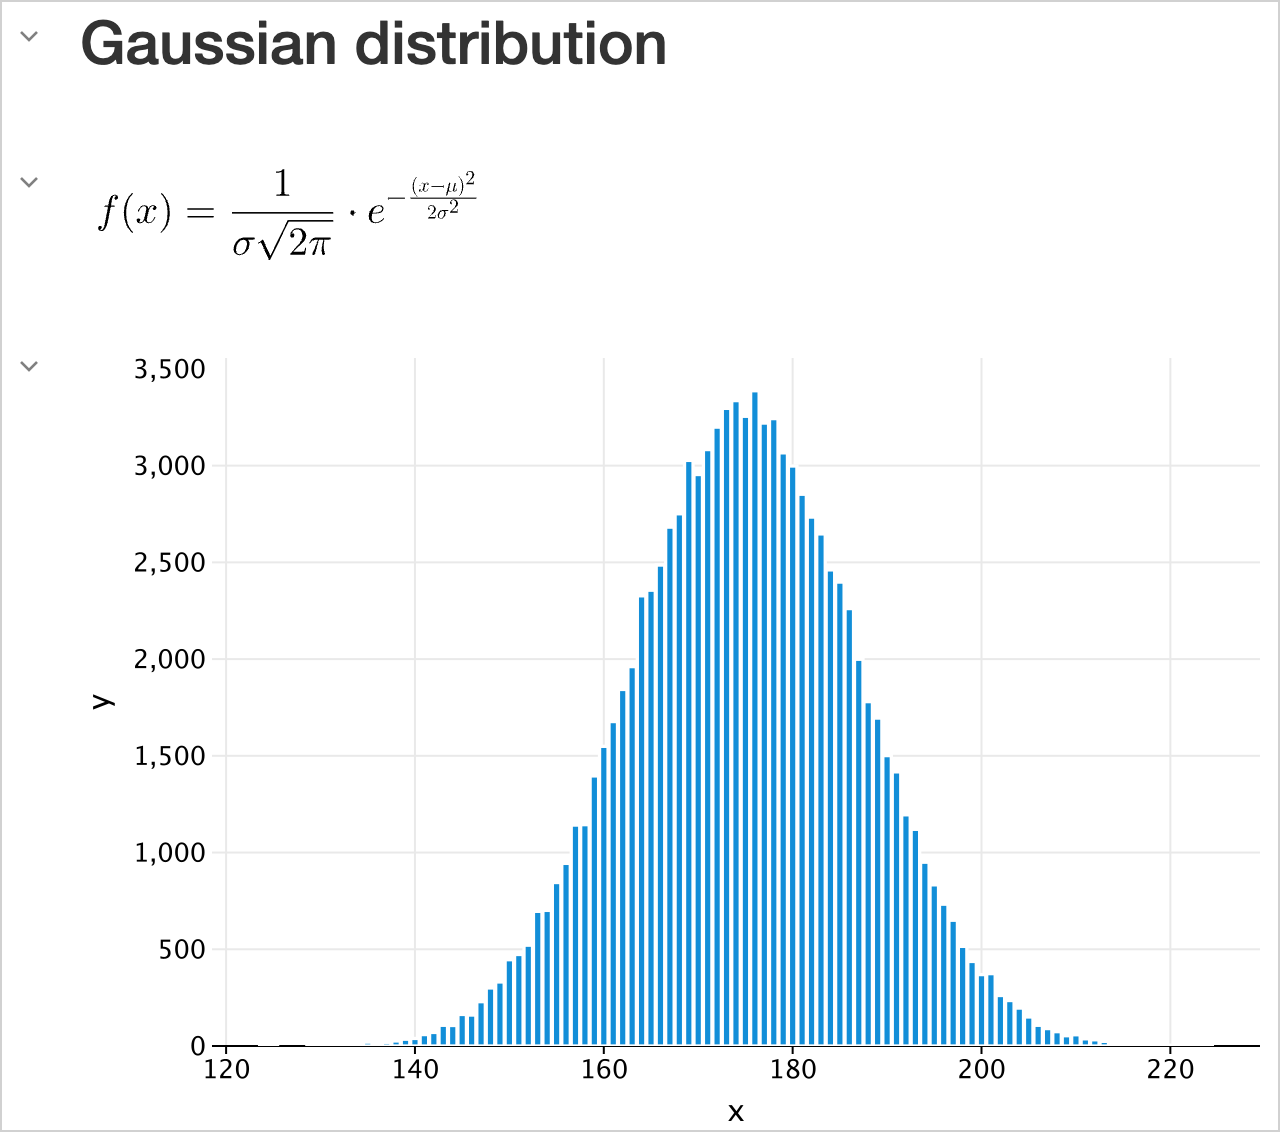
DISPLAY(HTML("<h2>Gaussian distribution</h2>"))
DISPLAY(LATEX("f(x) = \\frac{1}{\\sigma \\sqrt{2\\pi}} \\cdot e^{-\\frac{(x - \\mu)^2}{2\\sigma^2}}"))

val experimentX = experimentData.map { it.key }
val experimentY = experimentData.map { it.value }

DISPLAY(plot {
    bars {
        x(experimentX)
        y(experimentY)
    }
})
Texts
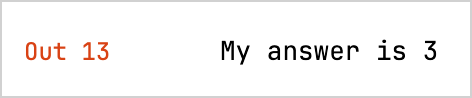
Plain text
最も単純な出力タイプはプレーンテキストです。これは、プリントステートメント、変数、またはコードからのテキストベースの出力で使用されます。
val a1: Int = 1
val a2: Int = 2
var a3: Int? = a1 + a2

"My answer is $a3"
- セルの結果が rendered され、いずれかの出力タイプとして表示できない場合、
toString()関数を使用してプレーンテキストとして出力されます。 - コードにエラーが含まれている場合、Kotlin Notebook はエラーメッセージとトレースバックを表示し、デバッグのための情報を提供します。
Rich text
リッチテキストを使用するには、Markdownタイプのセルを選択します。これにより、リスト、テーブル、フォントスタイル、コードブロックなどを使用して、MarkdownおよびHTMLマークアップでコンテンツをフォーマットできます。HTMLにはCSSスタイルとJavaScriptを含めることができます。
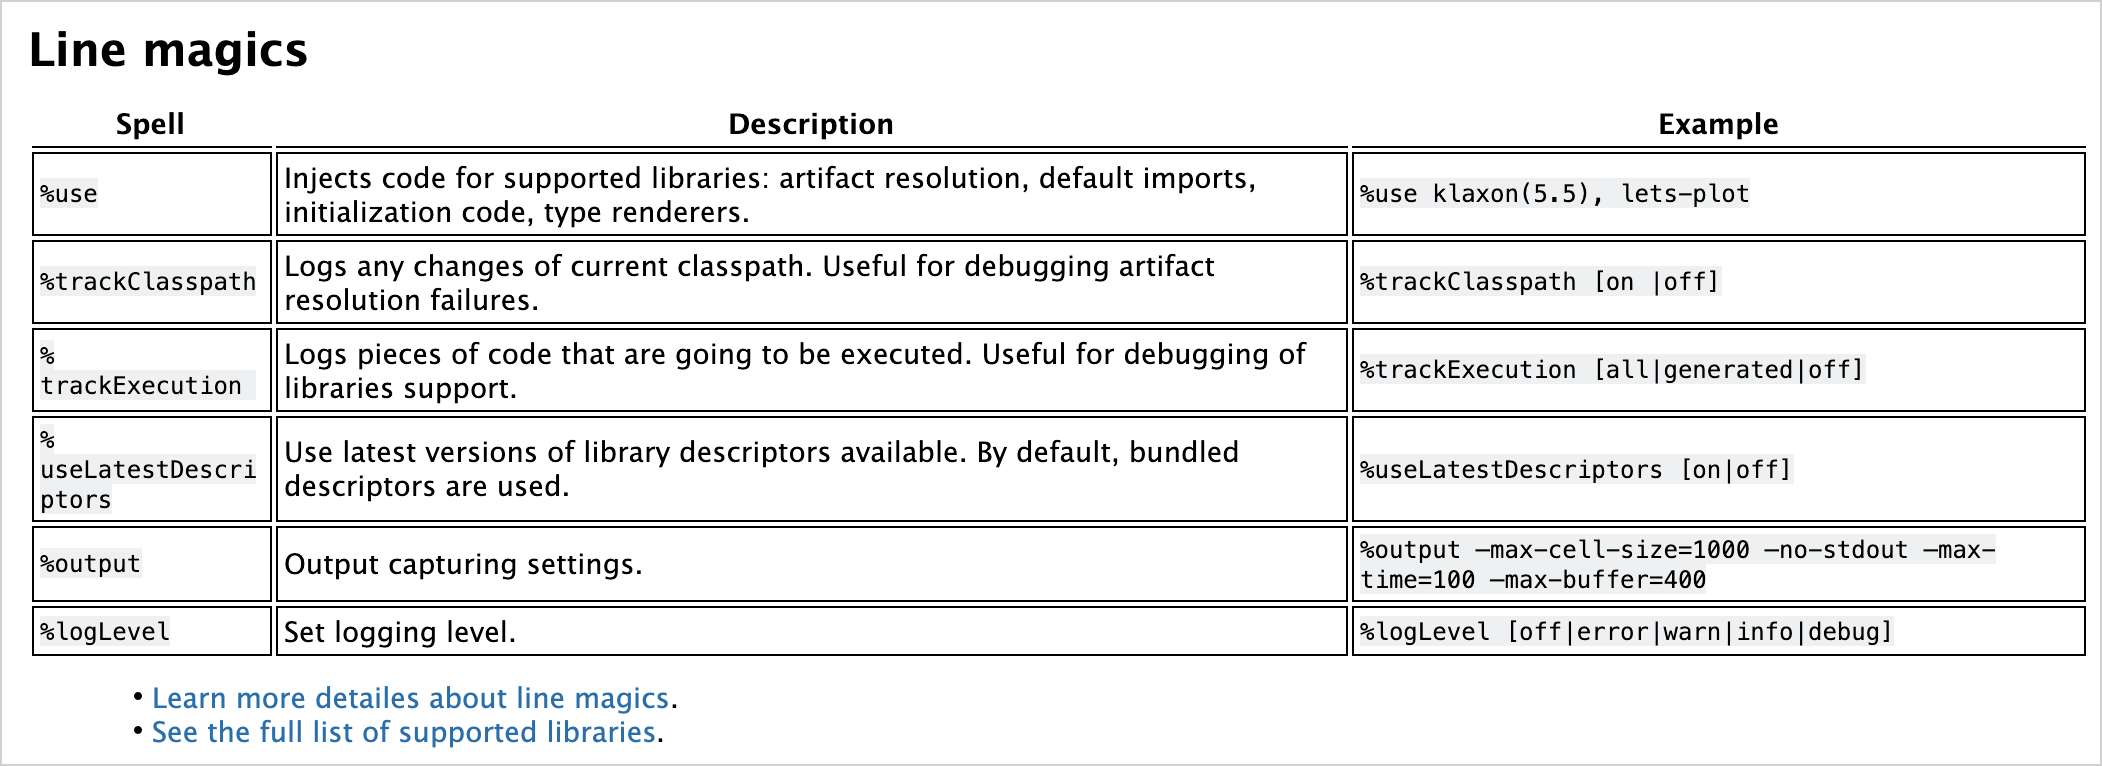
## Line magics

| Spell                              | Description                                                                                                      | Example                                                                               |
|------------------------------------|------------------------------------------------------------------------------------------------------------------|---------------------------------------------------------------------------------------|
| `%use`                  | Injects code for supported libraries: artifact resolution, default imports, initialization code, type renderers. | `%use klaxon(5.5), lets-plot`                                              |
| `%trackClasspath`       | Logs any changes of current classpath. Useful for debugging artifact resolution failures.                        | `%trackClasspath [on |off]`                                                |
| `%trackExecution`       | Logs pieces of code that are going to be executed. Useful for debugging of libraries support.                    | `%trackExecution [all|generated|off]`                                      |
| `%useLatestDescriptors` | Use latest versions of library descriptors available. By default, bundled descriptors are used.                  | `%useLatestDescriptors [on|off]`                                           |
| `%output`               | Output capturing settings.                                                                                       | `%output --max-cell-size=1000 --no-stdout --max-time=100 --max-buffer=400` |
| `%logLevel`             | Set logging level.                                                                                               | `%logLevel [off|error|warn|info|debug]`                                    |
<ul><li><a href="https://github.com/Kotlin/kotlin-jupyter/blob/master/docs/magics">Learn more detailes about line magics</a>.</li>
<li><a href="https://github.com/Kotlin/kotlin-jupyter/blob/master/docs/magics">See the full list of supported libraries</a>.</li></ul>
HTML
Kotlin Notebook はHTMLを直接レンダリングでき、スクリプトを実行したり、Webサイトを埋め込んだりすることもできます。
HTML("""
<p>
   Counter: <span id="ctr">0</span> <button onclick="inc()">Increment</button>
</p>
<script>
    function inc() {
        let counter = document.getElementById("ctr")
        counter.innerHTML = parseInt(counter.innerHTML) + 1;
}
</script>
""")

スクリプトを実行できるようにするには、ファイルの先頭でノートブックを信頼済みとしてマークしてください。
Images
Kotlin Notebook を使用すると、ファイルからの画像、生成されたグラフ、その他のビジュアルメディアを表示できます。
静止画像は、.png、jpeg、.svgなどの形式で表示できます。
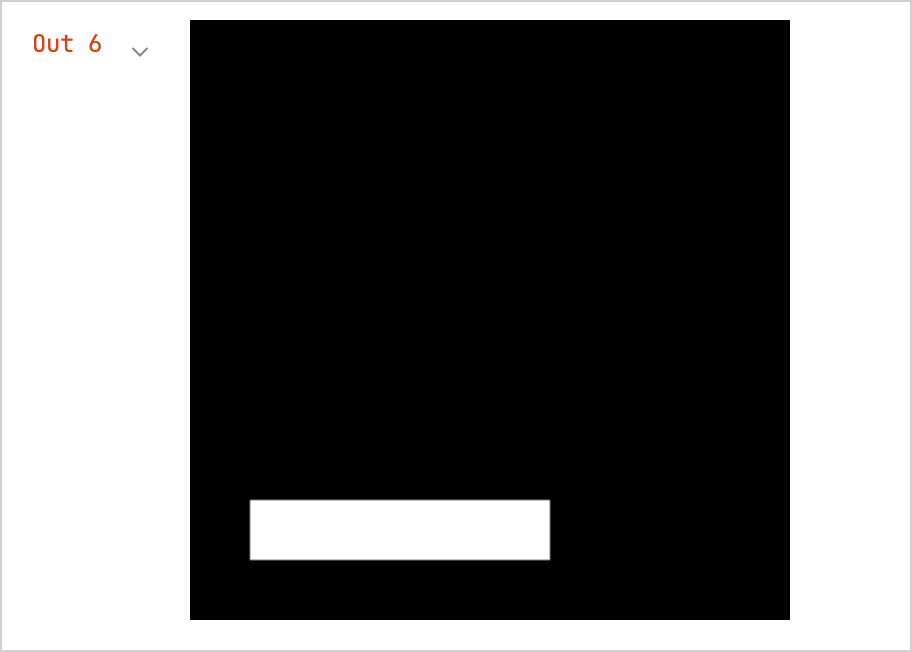
Buffered images
デフォルトでは、BufferedImage クラスを使用して画像を表示できます。
import java.awt.Color
import java.awt.image.BufferedImage

val width = 300
val height = width

val image = BufferedImage(width, height, BufferedImage.TYPE_INT_ARGB)

val graphics = image.createGraphics()
graphics.background = Color.BLACK
graphics.clearRect(0, 0, width, height)
graphics.setRenderingHint(
    java.awt.RenderingHints.KEY_ANTIALIASING,
    java.awt.RenderingHints.VALUE_ANTIALIAS_ON
)
graphics.color = Color.WHITE
graphics.fillRect(width / 10, height * 8 / 10, width * 10 / 20, height / 10)
graphics.dispose()
Loaded images
lib-ext ライブラリを使用すると、標準のJupyter機能を拡張し、ネットワークからロードされた画像を表示できます。
%use lib-ext(0.11.0-398)
Image("https://kotlinlang.org/docs/images/kotlin-logo.png", embed = false).withWidth(300)

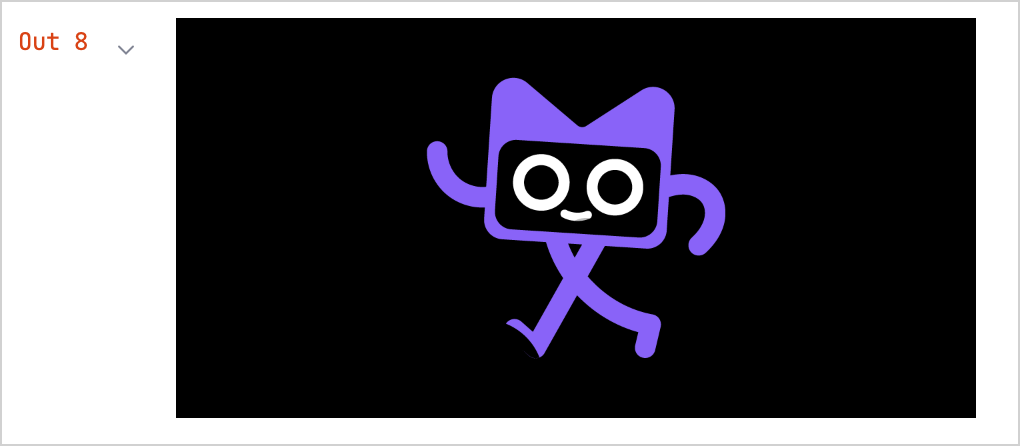
Embedded images
ネットワークからロードされた画像の欠点は、リンクが切れたり、ネットワーク接続が失われたりすると、画像が表示されなくなることです。それを回避するには、埋め込み画像を使用します。例:
val kotlinMascot = Image("https://blog.jetbrains.com/wp-content/uploads/2023/04/DSGN-16174-Blog-post-banner-and-promo-materials-for-post-about-Kotlin-mascot_3.png", embed = true).withWidth(400)
kotlinMascot
Math formulas and equations
LaTeX format(学術界で広く使用されている組版システム)を使用して、数式や方程式をレンダリングできます。
-
Jupyterカーネルの機能を拡張する
lib-extライブラリをノートブックに追加します。%use lib-ext(0.11.0-398) -
新しいセルで、式を実行します。
LATEX("c^2 = a^2 + b^2 - 2 a b \\cos\\alpha")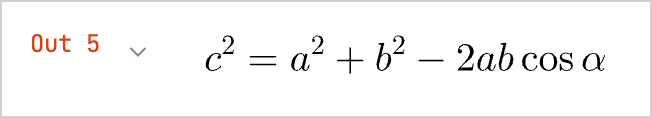
Data frames
Kotlin Notebook を使用すると、データフレームを使用して構造化されたデータを可視化できます。
-
Kotlin DataFrame ライブラリをノートブックに追加します。
%use dataframe -
データフレームを作成し、新しいセルで実行します。
val months = listOf(
    "January", "February",
    "March", "April", "May",
    "June", "July", "August",
    "September", "October", "November",
    "December"
)

// Sales data for different products and regions:
val salesLaptop = listOf(120, 130, 150, 180, 200, 220, 240, 230, 210, 190, 160, 140)
val salesSmartphone = listOf(90, 100, 110, 130, 150, 170, 190, 180, 160, 140, 120, 100)
val salesTablet = listOf(60, 70, 80, 90, 100, 110, 120, 110, 100, 90, 80, 70)

// A data frame with columns for Month, Sales, and Product
val dfSales = dataFrameOf(
    "Month" to months + months + months,
    "Sales" to salesLaptop + salesSmartphone + salesTablet,
    "Product" to List(12) { "Laptop" } + List(12) { "Smartphone" } + List(12) { "Tablet" },
)
データフレームは
dataFrameOf()関数を使用し、12か月の期間に販売された製品(ラップトップ、スマートフォン、タブレット)の数を含みます。 -
フレーム内のデータを調べます。たとえば、売上が最も高い製品と月を見つけます。
dfSales.maxBy("Sales")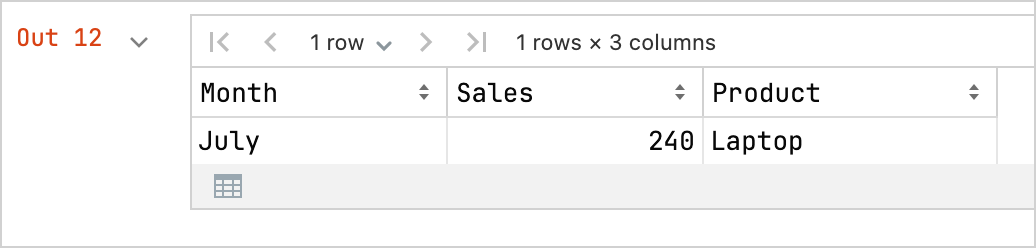
-
データフレームをCSVファイルとしてエクスポートすることもできます。
// Export your data to CSV format
dfSales.writeCSV("sales-stats.csv")
Charts
Kotlin Notebook で直接さまざまなチャートを作成して、データを可視化できます。
-
Kandy プロットライブラリをノートブックに追加します。
%use kandy -
同じデータフレームを使用し、新しいセルで
plot()関数を実行します。val salesPlot = dfSales.groupBy { Product }.plot {
bars {
// Access the data frame's columns used for the X and Y axes
x(Month)
y(Sales)
// Access the data frame's column used for categories and sets colors for these categories
fillColor(Product) {
scale = categorical(
"Laptop" to Color.PURPLE,
"Smartphone" to Color.ORANGE,
"Tablet" to Color.GREEN
)
legend.name = "Product types"
}
}
// Customize the chart's appearance
layout.size = 1000 to 450
layout.title = "Yearly Gadget Sales Results"
}
salesPlot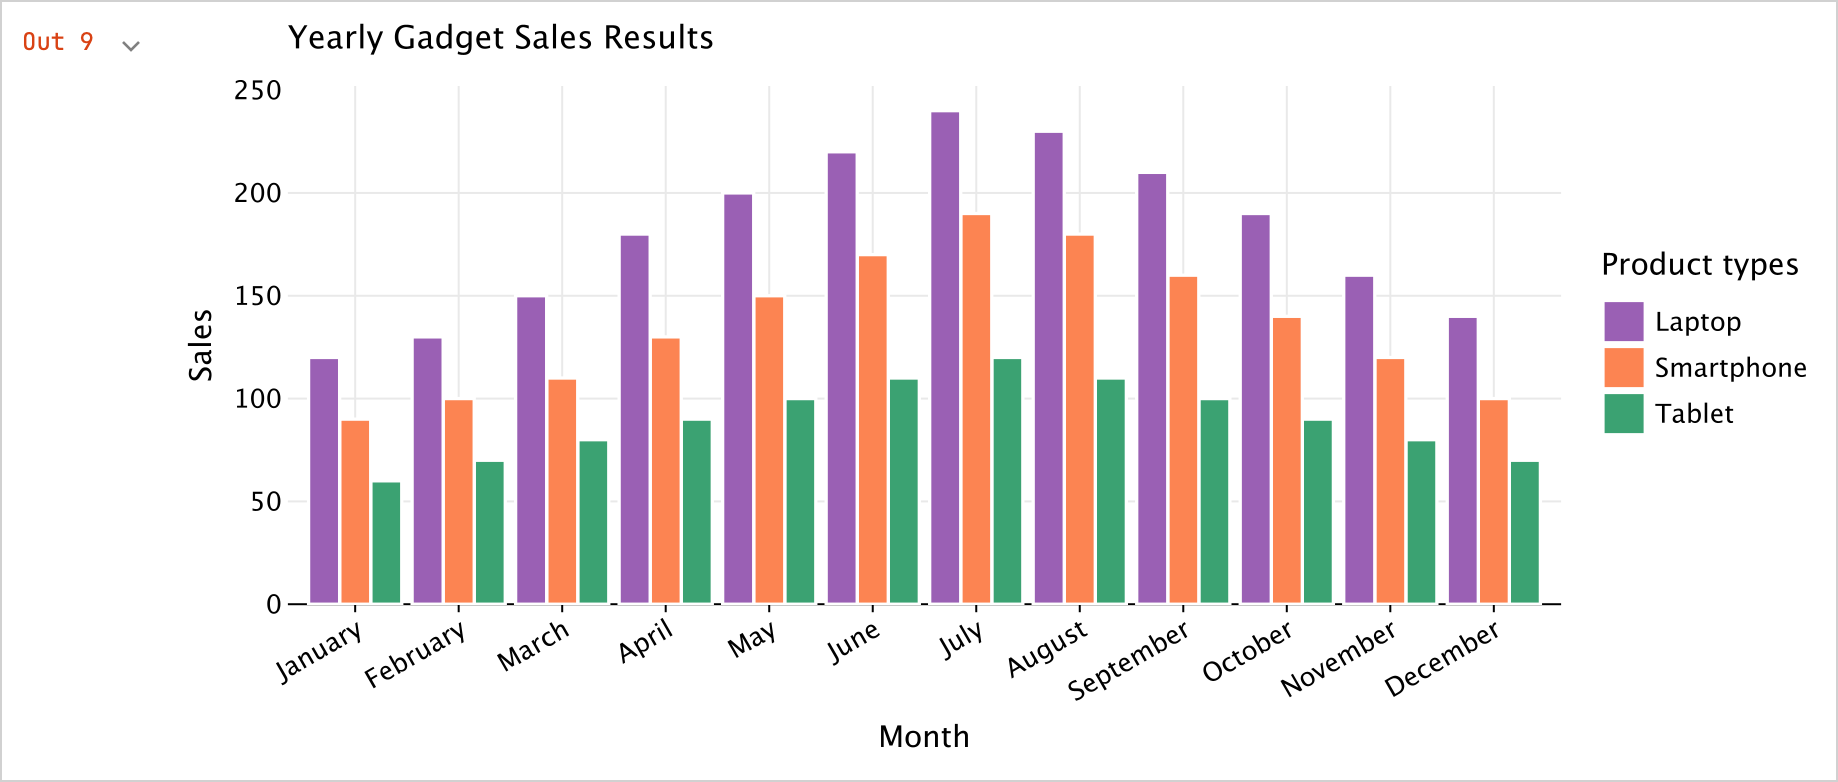
-
プロットを
.png、jpeg、.html、または.svg形式でエクスポートすることもできます。// Specify the output format for the plot file:
salesPlot.save("sales-chart.svg")