Kotlin Notebook에서 지원하는 출력 형식
Kotlin Notebook은 텍스트, HTML, 이미지 등 다양한 출력 유형을 지원합니다. 외부 라이브러리를 활용하면 출력 옵션을 확장하고 차트, 스프레드시트 등으로 데이터를 시각화할 수 있습니다.
각 출력은 Jupiter MIME type을 일부 데이터에 매핑하는 JSON 객체입니다. 이 맵에서 Kotlin Notebook은 다른 유형 중에서 우선 순위가 가장 높은 지원되는 MIME type을 선택하고 다음과 같이 렌더링합니다.
- 텍스트는
text/plainMIME type을 사용합니다. - BufferedImage 클래스는 Base64 문자열에 매핑되는
image/pngMIME type을 사용합니다. - Image 클래스와 LaTeX 형식은
text/htmlMIME type과 내부의img태그를 사용합니다. - Kotlin DataFrame 테이블과 Kandy 플롯은 자체 내부 MIME type을 사용하며, 이는 정적 HTML 또는 이미지로 지원됩니다. 이렇게 하면 GitHub에 표시할 수 있습니다.
예를 들어, 셀 출력을 Markdown으로 사용하기 위해 매핑을 수동으로 설정할 수 있습니다.
MimeTypedResult(
    mapOf(
        "text/plain" to "123",
        "text/markdown" to "# HEADER",
        //other mime:value pairs
    )
)
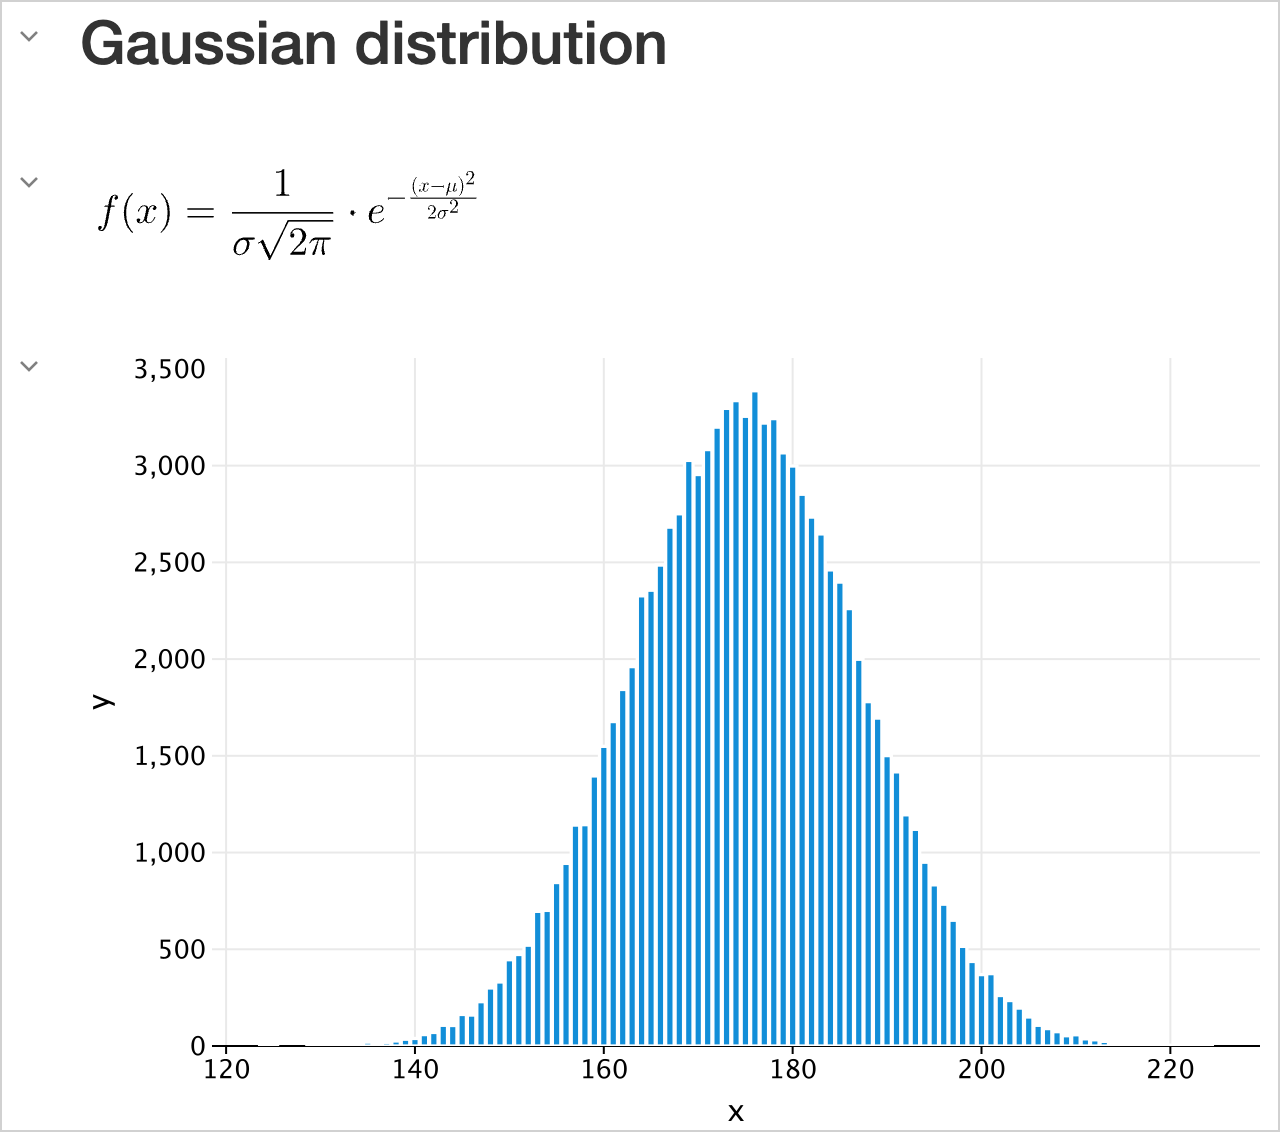
모든 종류의 출력을 표시하려면 DISPLAY() 함수를 사용하세요. 또한 여러 출력을 결합할 수 있습니다.
DISPLAY(HTML("<h2>Gaussian distribution</h2>"))
DISPLAY(LATEX("f(x) = \\frac{1}{\\sigma \\sqrt{2\\pi}} \\cdot e^{-\\frac{(x - \\mu)^2}{2\\sigma^2}}"))

val experimentX = experimentData.map { it.key }
val experimentY = experimentData.map { it.value }

DISPLAY(plot {
    bars {
        x(experimentX)
        y(experimentY)
    }
})
텍스트
일반 텍스트
가장 간단한 출력 유형은 일반 텍스트입니다. 인쇄된 문, 변수 값 또는 코드의 텍스트 기반 출력에 사용됩니다.
val a1: Int = 1
val a2: Int = 2
var a3: Int? = a1 + a2

"My answer is $a3"
- 셀 결과를 렌더링할 수 없고 출력 유형으로 표시할 수 없는 경우,
toString()함수를 사용하여 일반 텍스트로 인쇄됩니다. - 코드에 오류가 있는 경우 Kotlin Notebook은 디버깅을 위한 통찰력을 제공하는 오류 메시지와 추적 정보를 표시합니다.
서식 있는 텍스트
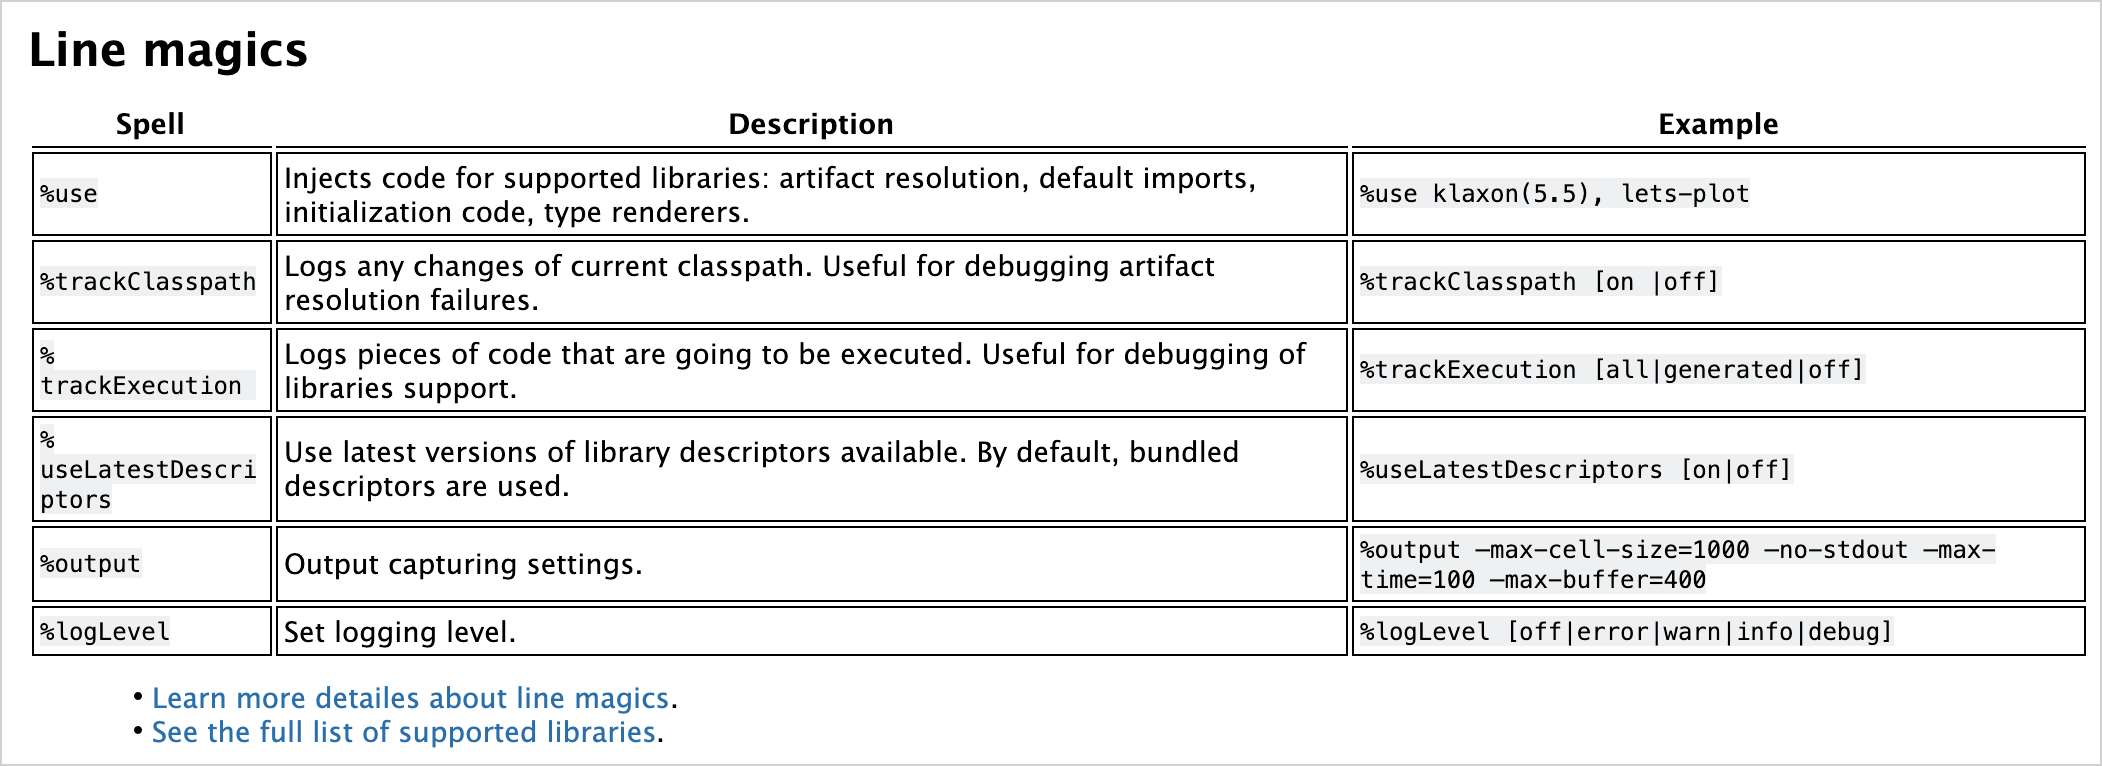
서식 있는 텍스트를 사용하려면 Markdown 유형의 셀을 선택하세요. 이렇게 하면 목록, 테이블, 글꼴 스타일, 코드 블록 등을 사용하여 Markdown 및 HTML 마크업으로 콘텐츠 형식을 지정할 수 있습니다. HTML은 CSS 스타일과 JavaScript를 포함할 수 있습니다.
## Line magics

| Spell                              | Description                                                                                                      | Example                                                                               |
|------------------------------------|------------------------------------------------------------------------------------------------------------------|---------------------------------------------------------------------------------------|
| `%use`                  | Injects code for supported libraries: artifact resolution, default imports, initialization code, type renderers. | `%use klaxon(5.5), lets-plot`                                              |
| `%trackClasspath`       | Logs any changes of current classpath. Useful for debugging artifact resolution failures.                        | `%trackClasspath [on |off]`                                                |
| `%trackExecution`       | Logs pieces of code that are going to be executed. Useful for debugging of libraries support.                    | `%trackExecution [all|generated|off]`                                      |
| `%useLatestDescriptors` | Use latest versions of library descriptors available. By default, bundled descriptors are used.                  | `%useLatestDescriptors [on|off]`                                           |
| `%output`               | Output capturing settings.                                                                                       | `%output --max-cell-size=1000 --no-stdout --max-time=100 --max-buffer=400` |
| `%logLevel`             | Set logging level.                                                                                               | `%logLevel [off|error|warn|info|debug]`                                    |
<ul><li><a href="https://github.com/Kotlin/kotlin-jupyter/blob/master/docs/magics">Learn more detailes about line magics</a>.</li>
<li><a href="https://github.com/Kotlin/kotlin-jupyter/blob/master/docs/magics">See the full list of supported libraries</a>.</li></ul>
HTML
Kotlin Notebook은 스크립트를 실행하거나 웹사이트를 임베딩하여 HTML을 직접 렌더링할 수 있습니다.
HTML("""
<p>
   Counter: <span id="ctr">0</span> <button onclick="inc()">Increment</button>
</p>
<script>
    function inc() {
        let counter = document.getElementById("ctr")
        counter.innerHTML = parseInt(counter.innerHTML) + 1;
}
</script>
""")
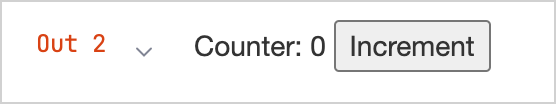
스크립트를 실행하려면 파일 상단에서 노트북을 신뢰할 수 있다고 표시하세요.
이미지
Kotlin Notebook을 사용하면 파일, 생성된 그래프 또는 기타 시각적 미디어에서 이미지를 표시할 수 있습니다. 정적 이미지는 .png, jpeg, .svg와 같은 형식으로 표시할 수 있습니다.
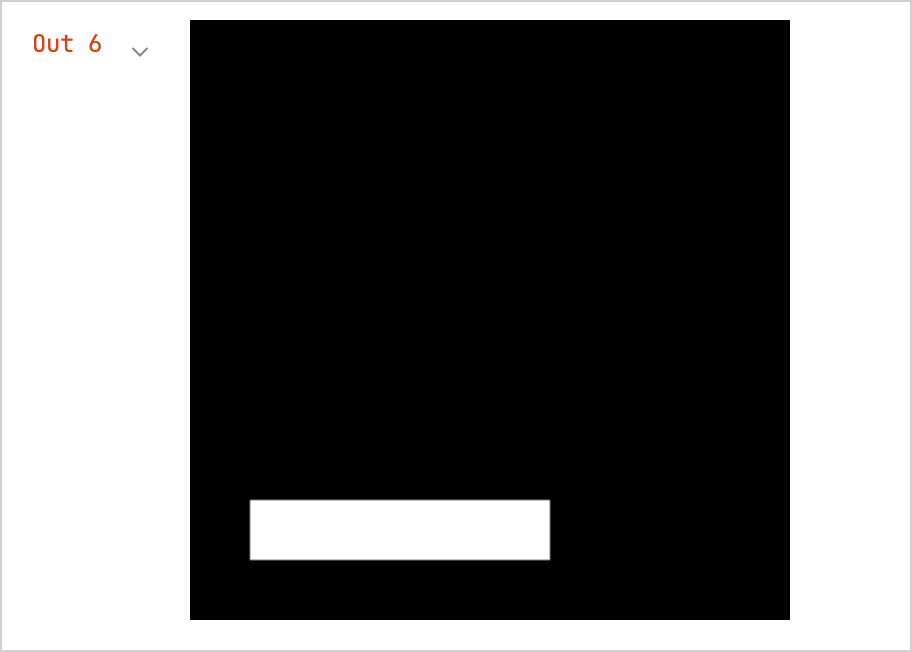
버퍼링된 이미지
기본적으로 BufferedImage 클래스를 사용하여 이미지를 표시할 수 있습니다.
import java.awt.Color
import java.awt.image.BufferedImage

val width = 300
val height = width

val image = BufferedImage(width, height, BufferedImage.TYPE_INT_ARGB)

val graphics = image.createGraphics()
graphics.background = Color.BLACK
graphics.clearRect(0, 0, width, height)
graphics.setRenderingHint(
    java.awt.RenderingHints.KEY_ANTIALIASING,
    java.awt.RenderingHints.VALUE_ANTIALIAS_ON
)
graphics.color = Color.WHITE
graphics.fillRect(width / 10, height * 8 / 10, width * 10 / 20, height / 10)
graphics.dispose()
로드된 이미지
lib-ext 라이브러리를 사용하면 표준 Jupyter 기능을 확장하고 네트워크에서 로드된 이미지를 표시할 수 있습니다.
%use lib-ext(0.11.0-398)
Image("https://kotlinlang.org/docs/images/kotlin-logo.png", embed = false).withWidth(300)

임베디드 이미지
네트워크에서 로드된 이미지의 단점은 링크가 끊어지거나 네트워크 연결이 끊어지면 이미지가 사라진다는 것입니다. 이를 해결하려면 다음과 같이 임베디드 이미지를 사용하세요.
val kotlinMascot = Image("https://blog.jetbrains.com/wp-content/uploads/2023/04/DSGN-16174-Blog-post-banner-and-promo-materials-for-post-about-Kotlin-mascot_3.png", embed = true).withWidth(400)
kotlinMascot
수학 공식 및 방정식
학계에서 널리 사용되는 조판 시스템인 LaTeX 형식을 사용하여 수학 공식과 방정식을 렌더링할 수 있습니다.
-
Jupyter 커널의 기능을 확장하는
lib-ext라이브러리를 노트북에 추가합니다.%use lib-ext(0.11.0-398) -
새 셀에서 공식을 실행합니다.
LATEX("c^2 = a^2 + b^2 - 2 a b \\cos\\alpha")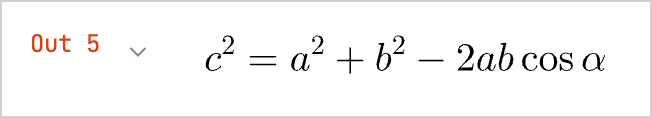
데이터 프레임
Kotlin Notebook을 사용하면 데이터 프레임으로 구조화된 데이터를 시각화할 수 있습니다.
-
Kotlin DataFrame 라이브러리를 노트북에 추가합니다.
%use dataframe -
데이터 프레임을 만들고 새 셀에서 실행합니다.
val months = listOf(
    "January", "February",
    "March", "April", "May",
    "June", "July", "August",
    "September", "October", "November",
    "December"
)

// Sales data for different products and regions:
val salesLaptop = listOf(120, 130, 150, 180, 200, 220, 240, 230, 210, 190, 160, 140)
val salesSmartphone = listOf(90, 100, 110, 130, 150, 170, 190, 180, 160, 140, 120, 100)
val salesTablet = listOf(60, 70, 80, 90, 100, 110, 120, 110, 100, 90, 80, 70)

// A data frame with columns for Month, Sales, and Product
val dfSales = dataFrameOf(
    "Month" to months + months + months,
    "Sales" to salesLaptop + salesSmartphone + salesTablet,
    "Product" to List(12) { "Laptop" } + List(12) { "Smartphone" } + List(12) { "Tablet" },
)
데이터 프레임은
dataFrameOf()함수를 사용하며 12개월 동안 판매된 제품(노트북, 스마트폰, 태블릿) 수를 포함합니다. -
예를 들어, 판매량이 가장 많은 제품과 월을 찾아 프레임에서 데이터를 탐색합니다.
dfSales.maxBy("Sales")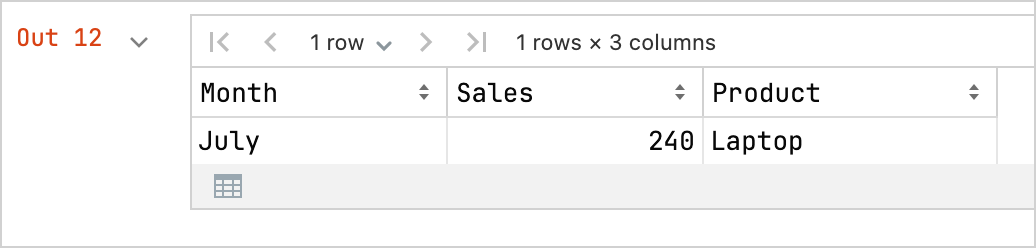
-
데이터 프레임을 CSV 파일로 내보낼 수도 있습니다.
// Export your data to CSV format
dfSales.writeCSV("sales-stats.csv")
차트
Kotlin Notebook에서 직접 다양한 차트를 만들어 데이터를 시각화할 수 있습니다.
-
Kandy 플로팅 라이브러리를 노트북에 추가합니다.
%use kandy -
동일한 데이터 프레임을 사용하고 새 셀에서
plot()함수를 실행합니다.val salesPlot = dfSales.groupBy { Product }.plot {
bars {
// Access the data frame's columns used for the X and Y axes
x(Month)
y(Sales)
// Access the data frame's column used for categories and sets colors for these categories
fillColor(Product) {
scale = categorical(
"Laptop" to Color.PURPLE,
"Smartphone" to Color.ORANGE,
"Tablet" to Color.GREEN
)
legend.name = "Product types"
}
}
// Customize the chart's appearance
layout.size = 1000 to 450
layout.title = "Yearly Gadget Sales Results"
}
salesPlot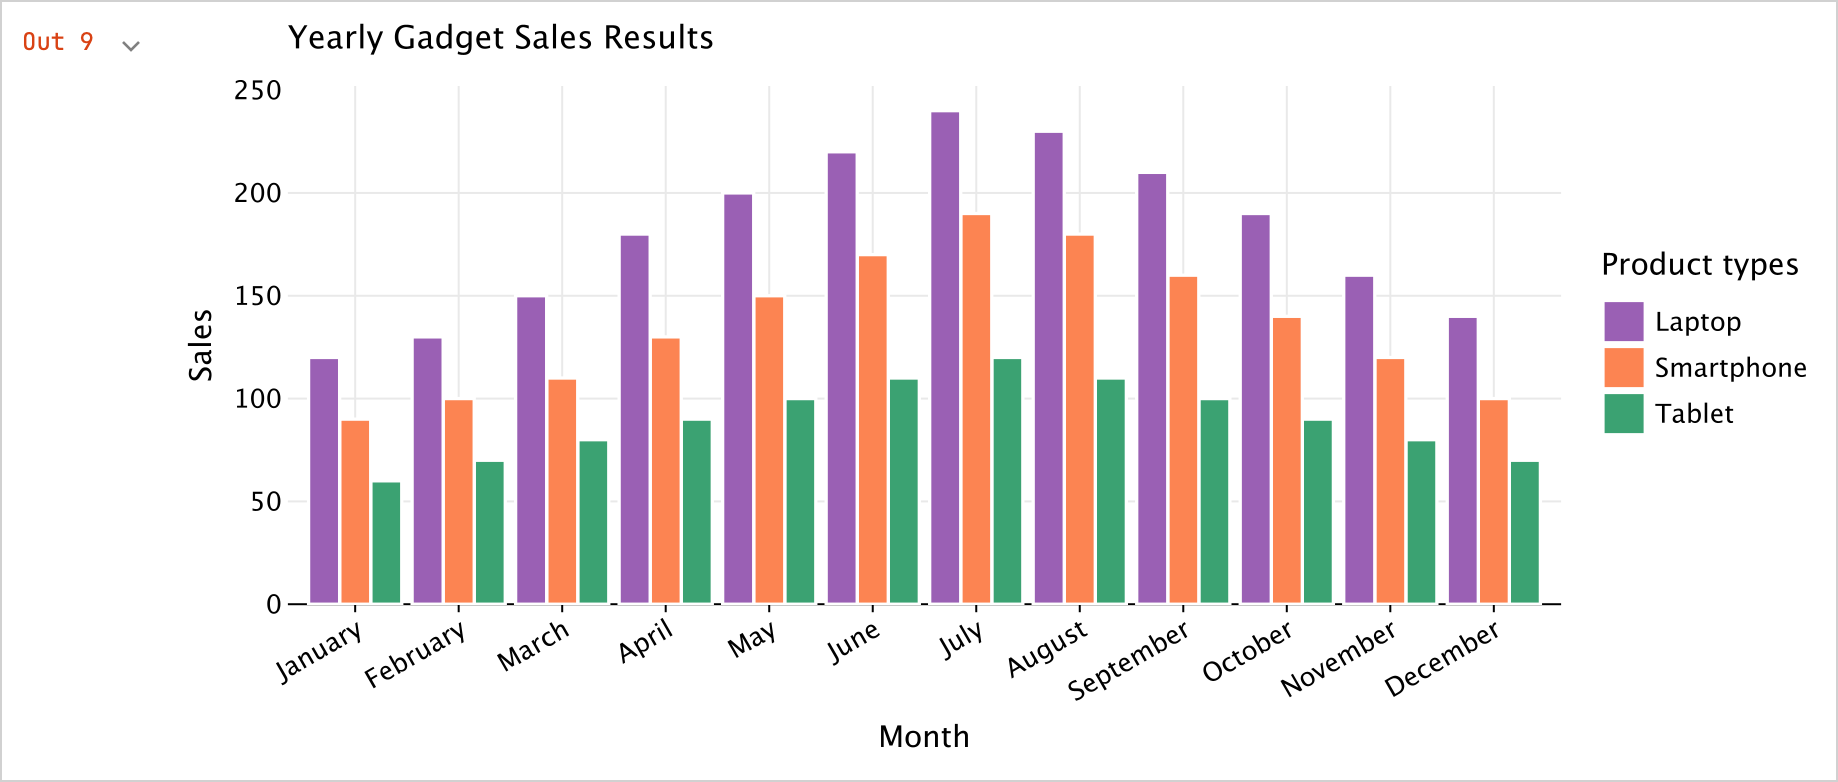
-
플롯을
.png,jpeg,.html또는.svg형식으로 내보낼 수도 있습니다.// Specify the output format for the plot file:
salesPlot.save("sales-chart.svg")